

Mean radius:
Toricity:
Steepest meridian:
Eccentricity (e):
Scale type
Flattest K (mm):
Steepest K (mm):
Astigmatism (D):
Asphericity (Q):
BFS radius (mm):
TopoVirtual is licensed under CC BY-NC-SA 4.0![]()
![]()
![]()
![]()
This section allows selecting the geometry of the simulated cornea and the scale type:
- Mean radius: average value of the radius of the principal meridians at the apex.
- Toricity: difference in radius between the principal meridians at the apex.
- Steepest meridian: orientation of the meridian with highest curvature (its refractive axis is orientated perpendicular to the meridian).
- Eccentricity: asphericity calculated from the eccentricity of an ellipse (in this simulation, it is constant; but in a real cornea, it can vary with the diameter).
- Scale type: the absolute scale maintains maximum and minimum values for all corneas; the relative scale adapts values to the range of each cornea.
This section shows the keratometric data of the simulated cornea:
- Flattest K: radius of curvature and orientation of the flattest meridian at the apex.
- Steepest K: radius of curvature and orientation of the steepest meridian at the apex.
- Astigmatism: power and axis of corneal astigmatism (assuming 0.20 mm equals to 1 D).
- Asphericity: flattening of the cornea as we move from the apex towards the periphery (Q = -e²).
- BFS radius: radius of the best fit sphere (BFS), reference for calculating corneal elevation.
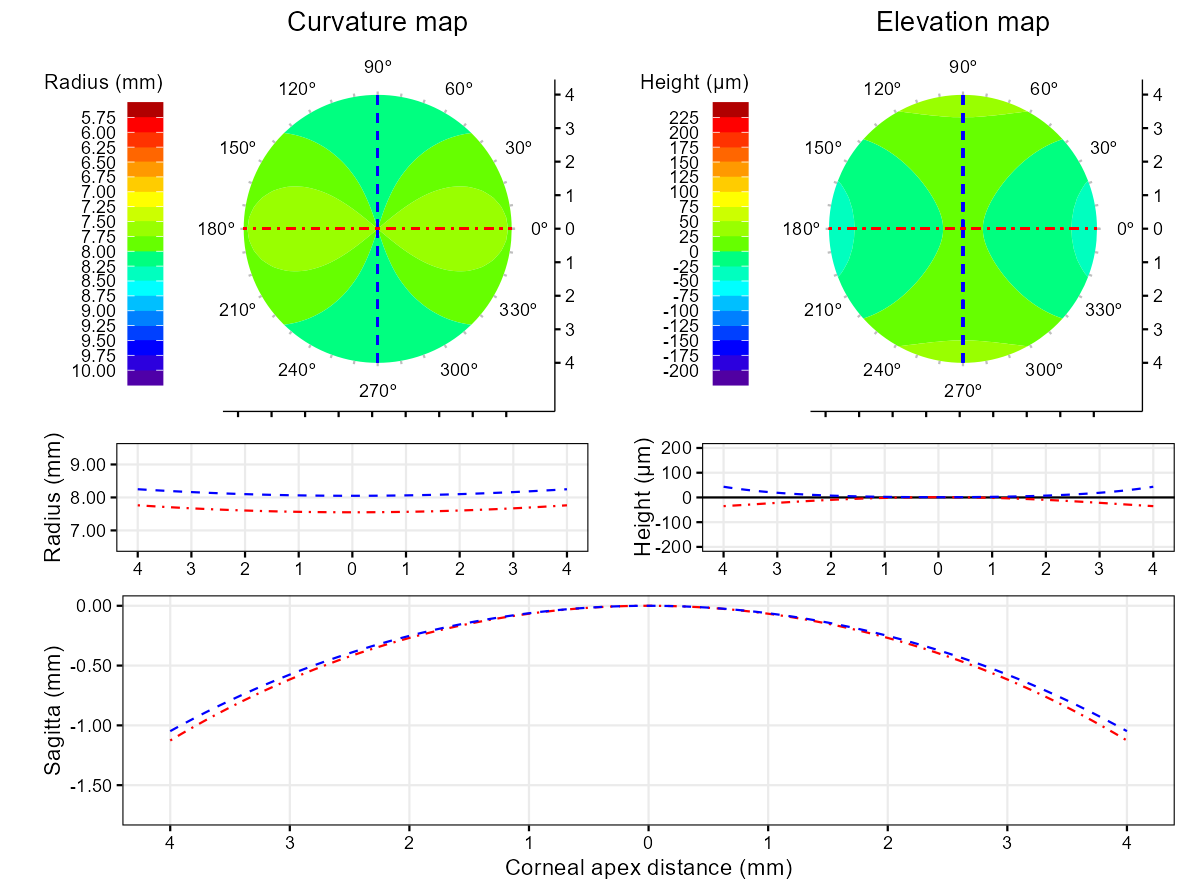
The curvature map shows the corneal radius at each point:
- The X-Y coordinate axes represent the distance to the corneal apex in mm.
- The principal meridians are represented by the blue (flatter) and red lines (steeper).
- Warm colors (yellow and red tones) represent areas with higher curvature (smaller radius).
- Cool colors (blue and purple tones) represent areas with lower curvature (larger radius).
The elevation map shows the corneal height at each point with respect to the best fit sphere:
- The X-Y coordinate axes represent the distance to the corneal apex in mm.
- The principal meridians are represented by the blue (flatter) and red lines (steeper).
- Warm colors (yellow and red tones) represent areas with higher elevation than the best fit sphere.
- Cool colors (blue and purple tones) represent areas with lower elevation than the best fit sphere.
This graph shows the corneal radius of the principal meridians (curvature profile):
- The X-axis represents the distance to the corneal apex in mm.
- The blue line represents the flattest meridian, and the red line represents the steepest meridian.
- Areas with higher curvature are represented by smaller radius values.
- Areas with lower curvature are represented by larger radius values.
This graph shows the corneal height of the principal meridians with respect to the best fit sphere (elevation profile):
- The X-axis represents the distance to the corneal apex in mm.
- The horizontal black line (value 0) represents the best fit sphere.
- The blue line represents the flattest meridian, and the red line represents the steepest meridian.
- Values above the horizontal black line are elevated compared to the best fit sphere.
- Values below the horizontal black line are depressed compared to the best fit sphere.
This graph shows the corneal sagittal height of the principal meridians (sagittal profile):
- The blue line represents the flattest meridian, and the red line represents the steepest meridian.
- The value 0,0 corresponds to the corneal apex.